What is LogRocket
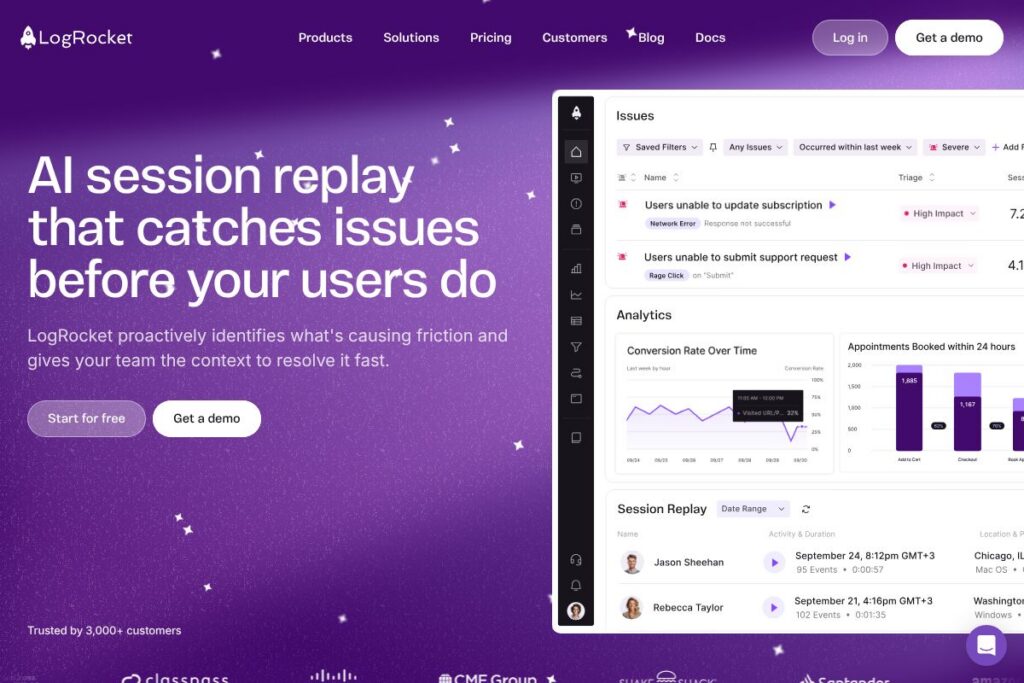
LogRocket is a session replay and frontend observability platform that records user sessions, collects performance telemetry, and surfaces analytics to help teams find and fix issues that affect customers. It connects replayed user interactions with console logs, network requests, and error traces so engineers and product teams can see what actually happened rather than guessing from logs alone.
LogRocket sits between developer tooling like Sentry and product analytics platforms like FullStory and Amplitude. Compared with Sentry, LogRocket places more emphasis on replaying user interactions alongside errors; compared with FullStory, it adds developer-oriented telemetry such as network logs and performance metrics. All of this makes LogRocket particularly useful for frontend teams that need a unified view of UX, errors, and performance.
LogRocket does well when you need to reproduce edge-case bugs that only appear in certain flows, correlate performance issues with user behavior, or prioritize fixes based on real user impact. It’s aimed at engineering and product teams building web and mobile experiences who want both qualitative replays and quantitative analytics in one place.
How LogRocket Works
Instrumentation begins with a lightweight SDK that you add to your web app or mobile app via NPM or a script tag, then configure to capture sessions and events. The SDK records a stream of DOM changes, user interactions, console output, network requests, and performance metrics and uploads them to LogRocket where sessions are reconstructed for replay.
Teams typically use LogRocket to triage issues by combining product analytics funnels and path analysis with session replay. For example, when a conversion funnel shows an unexpected drop, you can inspect aggregated paths, jump to sample sessions, and view the exact console errors and network failures that occurred during those sessions to pinpoint fixes.
LogRocket features
LogRocket bundles session replay with product analytics, error tracking, AI-assisted insights, and frontend performance monitoring to give teams a single pane of glass for user-facing problems. Recent platform additions emphasize AI-driven issue identification and tighter ties between analytics events and session replays.
What LogRocket Brings to the Table
Product Analytics
Build conversion funnels, path analysis, and time series charts to understand user flows and behavior at scale. These analytics tie back to individual sessions so you can move from aggregate signals to specific user replays to validate hypotheses.
Issues (AI-Driven Issue Detection)
AI surfaces technical and UX issues ranked by impact and frequency so you can focus on the areas of the app that matter most. The system highlights the exact changes likely to reduce user friction, helping prioritize engineering work.
Session Replay
Replay the exact experience of a user, including DOM playback, mouse and touch interactions, and screen updates. Each replay is augmented with console traces, network logs, and error data to reproduce and debug problems faster.
UX Analytics
Visualize aggregate user behavior with heatmaps, click maps, and path analysis while preserving the ability to inspect individual sessions. Combining qualitative replays with quantitative metrics lets product teams decide which UX changes will move the needle.
Error Tracking
Aggregate the most frequent client-side errors, network failures, and crashes, and link each issue to representative sessions. Built-in prioritization and AI triage reduce noise so engineering teams can address the highest-impact problems first.
Frontend Performance Monitoring
Correlate performance telemetry like page load, long tasks, and resource timings with actual user sessions to understand how slowdowns affect conversion and retention. Create dashboards and charts to measure performance changes over time and validate performance optimizations.
SDKs and Instrumentation
Installable via NPM or a script tag, the SDKs work across frameworks and capture events automatically while allowing manual instrumentation for custom events. The SDKs integrate with common build systems and provide a path to capture tailored metadata for debugging and analytics.
With LogRocket you get both the searchable, replayable session data developers need to fix bugs and the analytics dashboard product teams use to prioritize work, reducing time to resolution and improving user experience quality.
LogRocket pricing
LogRocket uses a subscription pricing model with plans tailored to teams of different sizes, plus custom enterprise options for higher volume and advanced needs. Since public plan details are not centralized here, check LogRocket’s official pages for the latest billing options and feature breakdowns.
For current signup and plan details, view LogRocket’s homepage or check LogRocket’s documentation for account and billing guidance. Enterprise customers can contact sales to discuss seat counts, session volumes, and SLAs through the platform’s enterprise channels.
What is LogRocket used for?
LogRocket is commonly used to reproduce and debug frontend issues that are difficult to replicate in development, such as user flows that fail in specific environments or on particular device types. Teams use it to go from an analytics alert or user report to a replay that shows console errors, network failures, and the DOM state at the time of the issue.
It is also used for UX research and conversion optimization, where product managers combine funnel analysis and path insights with session replays to identify friction points. Engineering, QA, and product teams benefit when they need to measure the user impact of performance regressions and prioritize fixes based on real user data.
Pros and cons of LogRocket
Pros
- Integrated session replay and telemetry: Combining DOM playback with console, network, and performance data makes reproducing client-side issues faster and more precise.
- Product analytics tied to replays: Funnels, path analysis, and time series charts link directly to sessions so teams can move from aggregate signals to individual user contexts without switching tools.
- AI-assisted issue prioritization: Automated detection and ranking of UX and technical issues helps focus limited engineering resources on high-impact problems.
Cons
- Data volume considerations: Capturing full session replays can increase storage and bandwidth needs, so teams must plan sampling and retention to control costs and noise.
- Privacy and compliance configuration required: Capturing user sessions requires careful masking and configuration to avoid collecting PII, so teams need to implement data controls and review retention policies.
Does LogRocket Offer a Free Trial?
LogRocket offers a free tier and trial options for new users. The free tier and trial let teams evaluate core features such as session replay, basic product analytics, and error aggregation before committing to a paid plan; for the exact limits and trial length, sign up or review LogRocket’s account options on LogRocket’s signup and account pages.
LogRocket API and Integrations
LogRocket provides SDKs for web and mobile platforms and exposes APIs and webhooks for exporting data and connecting with other systems. The API documentation and integration guides describe endpoints for session export, event ingestion, and webhook configuration; see the LogRocket documentation for developer details.
Key integrations include observability and collaboration tools such as Slack, Sentry, Datadog, Segment, Jira, and analytics platforms so you can forward issues and alert teams where they already work. Explore LogRocket integrations to see supported connectors and configuration steps.
10 LogRocket alternatives
Paid alternatives to LogRocket
- FullStory — Session replay and digital experience analytics with strong UX research capabilities and path analysis for product teams.
- Sentry — Error monitoring focused on error aggregation, stack traces, and performance monitoring, often used alongside replay tools for deeper debugging.
- Hotjar — UX analytics and feedback tools centered on heatmaps, session recordings, and on-page surveys for qualitative research.
- Amplitude — Product analytics platform for tracking user behavior, funnels, and cohorts at scale with an emphasis on behavioral analytics.
- Bugsnag — Error monitoring and stability score tooling for prioritizing and diagnosing client-side and server-side crashes.
- Mixpanel — Event-based analytics for product teams with strong cohorting and funnel capabilities for conversion optimization.
Open source alternatives to LogRocket
- PostHog — Open source product analytics and session recording platform you can self-host; includes feature flags and event analytics.
- OpenReplay — Self-hosted session replay suite that records user sessions and replays DOM and interactions, suitable for teams that want full control over data.
- Matomo — Open source analytics focused on privacy and self-hosting with plugins for extended functionality, including session recordings through add-ons.
Frequently asked questions about LogRocket
What platforms does LogRocket support?
LogRocket supports web and mobile platforms via SDKs. The platform offers JavaScript SDKs for major frameworks and mobile SDKs to capture sessions across browsers and apps.
Does LogRocket have an API for exporting session data?
Yes, LogRocket provides APIs and webhooks for data export and integrations. Developers can use the documentation to configure exports, ingest events, and connect LogRocket to observability pipelines.
Can LogRocket capture network requests and console logs?
Yes, LogRocket records network activity and console output alongside session replays. Those telemetry items are available in each replay to help reproduce and diagnose issues.
Is LogRocket suitable for large enterprise deployments?
LogRocket offers enterprise-capable plans with custom SLAs and volume pricing. Enterprise customers can request features such as SSO, extended retention, and dedicated support through LogRocket’s sales channels.
How does LogRocket handle sensitive data and privacy?
LogRocket includes masking and privacy controls to avoid collecting PII. Teams can configure session sampling, field masking, and retention settings to meet compliance requirements and internal policies.
Final verdict: LogRocket
LogRocket excels at bringing session replay, frontend telemetry, and product analytics into one workflow so teams can quickly go from a high-level signal to a reproducible user session. Its combination of DOM playback, network and console logs, and AI-assisted issue discovery reduces the time engineers spend reproducing bugs and increases confidence in fixes.
Compared with FullStory, which focuses heavily on UX research and user experience analytics, LogRocket places more emphasis on developer-oriented telemetry and debugging context. Pricing for both platforms often requires contacting sales for enterprise needs, but LogRocket’s developer-centric feature set can be more useful for engineering teams that need deep debugging information alongside analytics. For teams that want to link customer-facing issues directly to code-level signals, LogRocket is a strong choice.